
Automated Lighthouse audits
Every page, every deployment — continuous performance monitoring across all your properties. No scripts, no dashboards to configure.
Introducing Clickweave
Connect real-user performance, behaviour, revenue, and search data to understand which technical issues are quietly holding back growth.
Trusted by performance-driven teams


Prioritisation
A slow page is not automatically the most urgent page. Clickweave ranks every opportunity by affected journeys, traffic quality, and revenue exposure — so your team works on what moves the business.

Monitoring
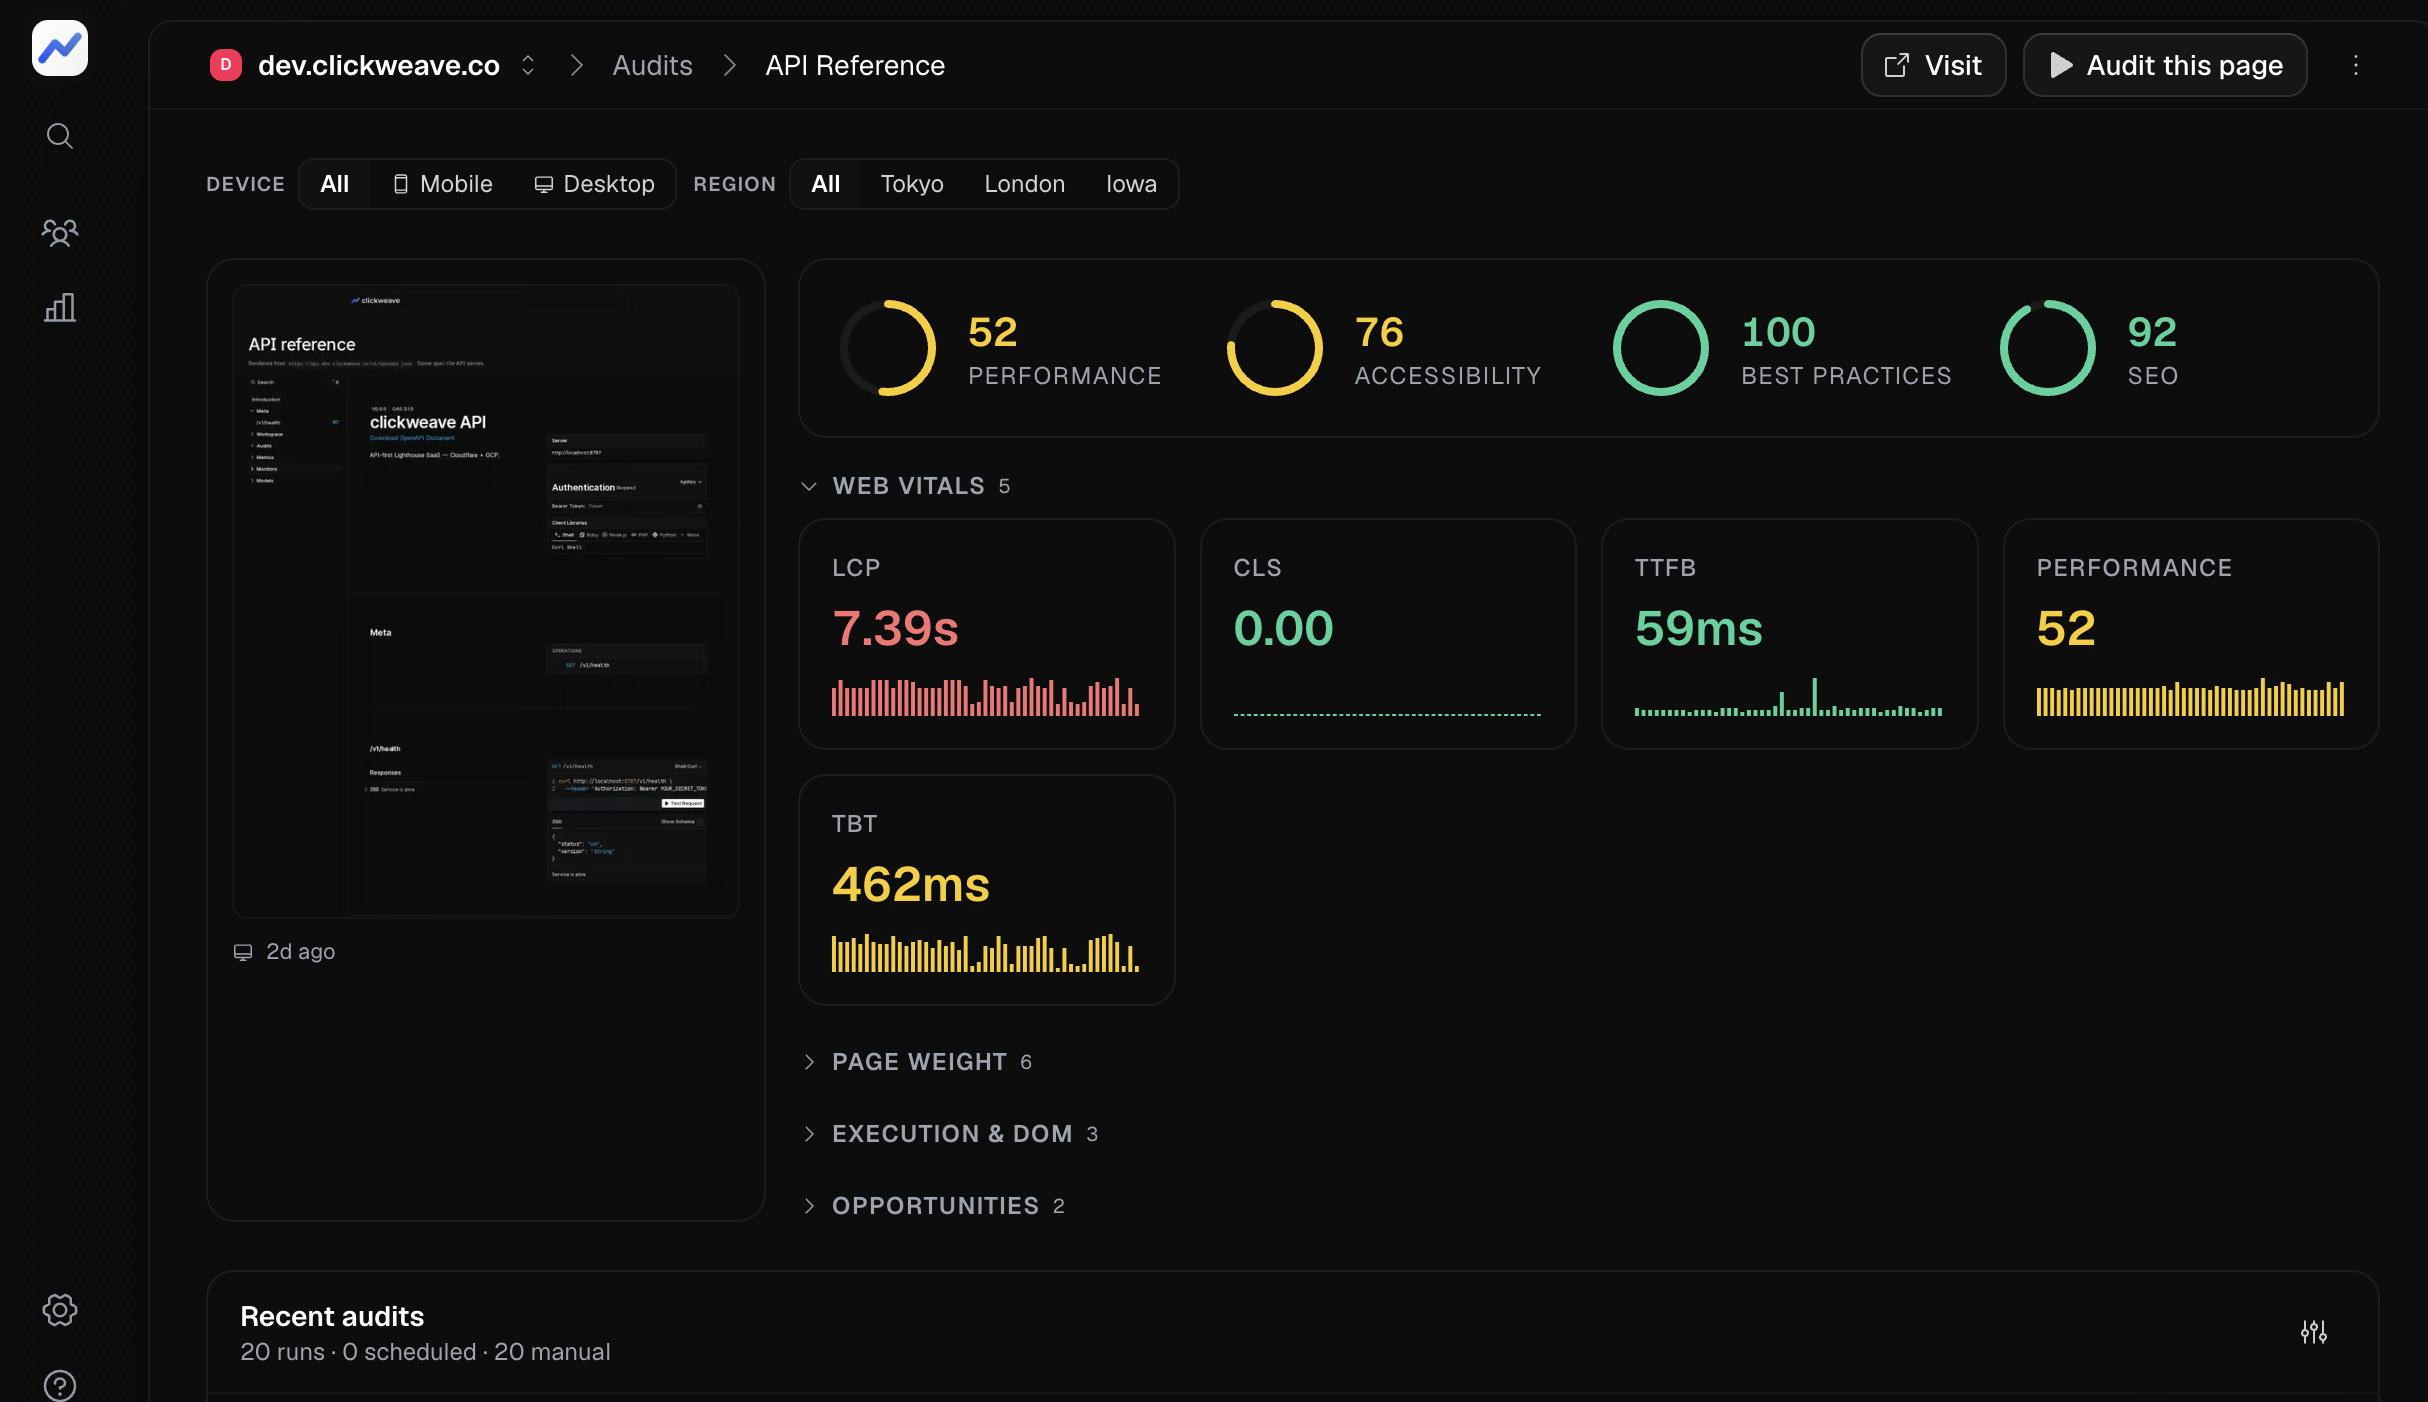
Lighthouse audits, Core Web Vitals, and real-user metrics are collected continuously for every page — not just the homepage. No scripts to install, no dashboards to configure.

For growth teams
Clickweave correlates performance, behaviour, and search data with commercial outcomes — so you always know which regressions are costing you money and which can wait.
A 20-point Lighthouse drop on your checkout page matters more than the same drop on your blog. Clickweave ranks every opportunity by affected revenue, so your team works on what actually moves the needle.
Developer-ready
A public REST API, webhooks for real-time events, and CI-ready Lighthouse audits that plug into your existing workflows. No dashboards required — integrate directly with your deployment pipeline.
GitHub
Seamless CI/CD via GitHub Actions.
CLI
On-demand audits from your terminal.
Webhooks
Real-time events to your backend.
Slack
Alerts to your team channels.
Signals
See how performance, behaviour, revenue, and search correlate — and what that means for your pipeline.
Every page, every deployment — continuous performance monitoring across all your properties. No scripts, no dashboards to configure.
LCP, CLS, INP — updated every 5 minutes.
Every metric change translated into revenue exposure.
“We identified $18k in at-risk revenue from a single LCP regression we would have missed.”Read the case study
Understand how performance, behaviour, and revenue interact in one unified view.
Built for teams that grow
One shared view for the teams responsible for speed, acquisition, conversion, and the numbers behind them.
Explore all use casesCatch regressions early and explain why they matter beyond a slower score.
See which slow journeys cost conversion and where fixes can recover demand.
Connect page experience, search demand, and landing page intent in one view.
Translate technical health into commercial impact without losing the detail.
Ready to see your performance data through a revenue lens?